

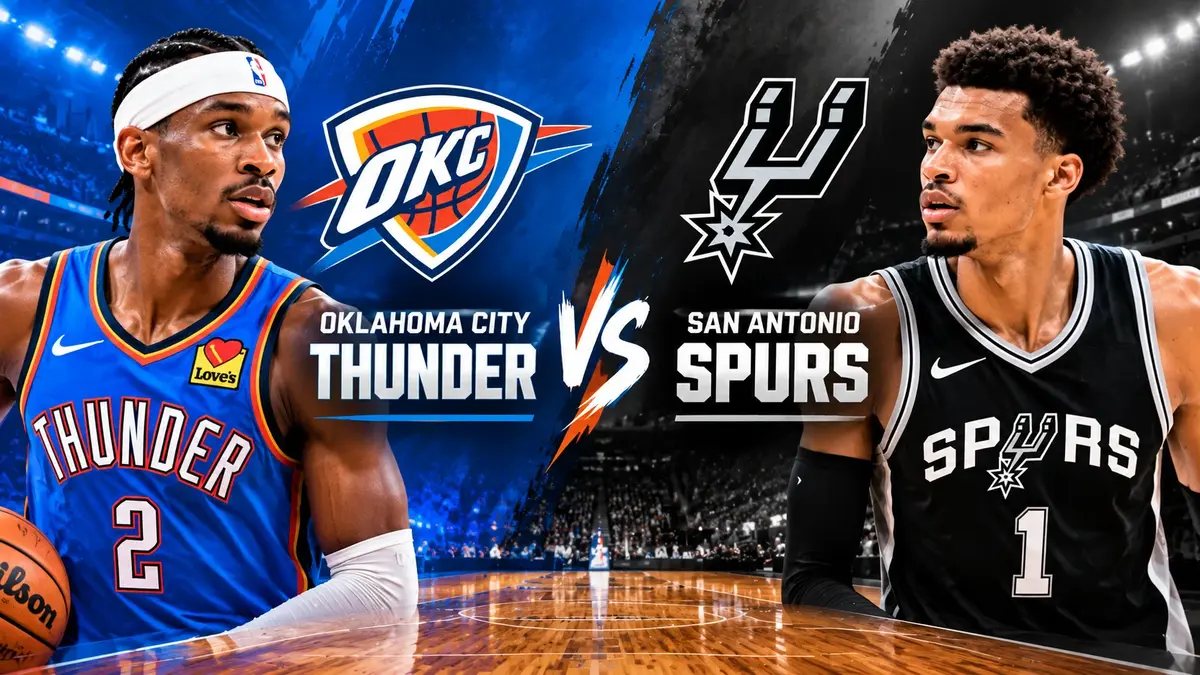
You want the facts on this rivalry, and you want them fast. Instead, you find scattered box scores, mixed-up series dates and recaps that skip the numbers. This guide fixes that. The Oklahoma City Thunder vs San Antonio Spurs timeline below covers every playoff series since 1982, then breaks down the 2026 Western Conference Finals with clean tables and plain-English takeaways.
A Quick Look at the Oklahoma City Thunder vs San Antonio Spurs timeline
San Antonio holds the edge in this rivalry. The Spurs lead the all-time regular-season series 106-90 across 196 games, and they lead the playoff count 5-2. Those totals include the years the franchise played as the Seattle SuperSonics, before it moved to Oklahoma City in 2008.
The two teams have met in the playoffs seven times. The Oklahoma City Thunder vs San Antonio Spurs timeline starts in 1982 and, until 2026, never produced a Game 7.
| Year | Round | Winner |
|---|---|---|
| 1982 | West Semifinals | Spurs over SuperSonics, 4-1 |
| 2002 | West First Round | Spurs over SuperSonics, 3-2 |
| 2005 | West Semifinals | Spurs over SuperSonics, 4-2 |
| 2012 | West Finals | Thunder over Spurs, 4-2 |
| 2014 | West Finals | Spurs over Thunder, 4-2 |
| 2016 | West Semifinals | Thunder over Spurs, 4-2 |
| 2026 | West Finals | Spurs over Thunder, 4-3 |
The Featured Game: Game 3 on May 22, 2026
Game 3 gives us the cleanest look at how these two teams clash, and it anchors the Oklahoma City Thunder vs San Antonio Spurs timeline for 2026. The Thunder arrived as the 64-win top seed and defending champions. The Spurs won 62 games, and this was the first conference finals home game in San Antonio since 2017. This series also marked the first playoff meeting of two 62-win teams since the 1998 Finals.
The Spurs opened on a 15-0 run, the longest opening run in a conference finals since the play-by-play era began in 1997. Oklahoma City missed its first six shots. Then the Thunder bench took over and won 123-108 to lead the series 2-1.
Note that Game 3 was not the last game of the series. Game 7 came on May 30, and we cover it in the game-by-game section below.
| Team | Q1 | Q2 | Q3 | Q4 | Final |
|---|---|---|---|---|---|
| Thunder | 26 | 32 | 37 | 28 | 123 |
| Spurs | 31 | 20 | 33 | 24 | 108 |
Team Totals and Efficiency Comparison
The Thunder shot better from everywhere and protected the ball. They made 17 threes to the Spurs’ 13 and turned it over five fewer times. In the Oklahoma City Thunder vs San Antonio Spurs timeline, few box scores look this lopsided.
| Stat | Thunder | Spurs |
|---|---|---|
| Field goals | 39-81 (48.1%) | 34-80 (42.5%) |
| Three-pointers | 17-38 (44.7%) | 13-41 (31.7%) |
| Free throws | 28-33 (84.8%) | 27-33 (81.8%) |
| Rebounds | 41 | 37 |
| Assists | 29 | 26 |
| Turnovers | 10 | 15 |
| Points in the paint | 42 | 40 |
| Second-chance points | 22 | 17 |
| Fast-break points | 2 | 13 |
| Bench points | 76 | 23 |
| Biggest lead | 18 | 15 |
San Antonio won the fast-break battle 13-2 and still lost by 15. The Thunder outscored the Spurs 97-77 over the final three quarters. Oklahoma City’s 76 bench points set a franchise postseason record.
Lead Guards and Playmaker Matchup
Shai Gilgeous-Alexander scored zero points in the first quarter. He finished with 26 points and 12 assists, and he made all 12 of his free throws. That patience shows how he attacks: he waits for the game to come to him.
| Player | Min | Pts | Ast | TO | FG | 3PT | FT |
|---|---|---|---|---|---|---|---|
| Shai Gilgeous-Alexander (OKC) | 36:12 | 26 | 12 | 2 | 6-17 | 2-4 | 12-12 |
| De’Aaron Fox (SA) | 30:44 | 15 | 6 | 4 | 7-14 | 1-6 | 0-0 |
| Stephon Castle (SA) | 34:35 | 14 | 7 | 1 | 1-8 | 1-5 | 11-14 |
| Cason Wallace (OKC) | 28:11 | 11 | 4 | 0 | 3-8 | 2-6 | 3-4 |
Fox returned to the starting lineup after missing the first two games. He scored efficiently but committed four of the Spurs’ 15 turnovers. Castle made only one field goal, though he lived at the free-throw line.
Frontcourt Scoring and Paint Performance
Both teams scored almost equally inside, which makes the Oklahoma City Thunder vs San Antonio Spurs timeline a battle of everything else. The Thunder made 21 of 32 shots in the paint, while the Spurs made 20 of 33. The gap came from everywhere else.
| Player | Team | Pts | FG | Reb | Ast |
|---|---|---|---|---|---|
| Victor Wembanyama | SA | 26 | 8-15 | 4 | 3 |
| Devin Vassell | SA | 20 | 6-12 | 7 | 2 |
| Chet Holmgren | OKC | 14 | 5-7 | 3 | 1 |
| Isaiah Hartenstein | OKC | 5 | 2-4 | 8 | 4 |
Wembanyama grabbed just four rebounds after collecting 41 across the first two games. Oklahoma City’s bigs kept him off the glass.
Three-Point Shooting and Bench Production
The Thunder reserves decided this game. Jared McCain, Jaylin Williams and Alex Caruso combined for 57 points, and all three finished with a plus-minus of +22 or better.
| Player | Pts | FG | 3PT | Plus/Minus |
|---|---|---|---|---|
| Jared McCain | 24 | 10-21 | 2-10 | +28 |
| Jaylin Williams | 18 | 5-7 | 5-6 | +22 |
| Alex Caruso | 15 | 4-7 | 3-5 | +28 |
The Spurs bench shot poorly by comparison. Dylan Harper scored six points on 2-of-7 shooting, and Keldon Johnson scored five on 1-of-5. Over the first three games, the Thunder bench outscored San Antonio’s 183-64.
Defensive Plays, Turnovers, and Blocks
Basketball has no sacks or tackles. Steals, blocks and turnovers add the defensive layer to the Oklahoma City Thunder vs San Antonio Spurs timeline. San Antonio blocked six shots to Oklahoma City’s two, but the Spurs gave away 15 turnovers.
Vassell led all players with four steals. Wallace picked up three for the Thunder. Wembanyama and Castle each blocked two shots. Oklahoma City’s defense held San Antonio to 31.7% from three, which erased the Spurs’ early lead.
Step-by-Step Game-Changing Moments in the Oklahoma City Thunder vs San Antonio Spurs timeline
Here is the full seven-game story of the 2026 series, with the date, site and result of each game.
| Game | Date | Site | Result | Series |
|---|---|---|---|---|
| 1 | May 18 | Oklahoma City | Spurs 122, Thunder 115 (2OT) | SA 1-0 |
| 2 | May 20 | Oklahoma City | Thunder 122, Spurs 113 | 1-1 |
| 3 | May 22 | San Antonio | Thunder 123, Spurs 108 | OKC 2-1 |
| 4 | May 24 | San Antonio | Spurs 103, Thunder 82 | 2-2 |
| 5 | May 26 | Oklahoma City | Thunder 127, Spurs 114 | OKC 3-2 |
| 6 | May 28 | San Antonio | Spurs 118, Thunder 91 | 3-3 |
| 7 | May 30 | Oklahoma City | Spurs 111, Thunder 103 | SA 4-3 |
Five moments defined the series:
- Game 1: Wembanyama scored 41 points and grabbed 24 rebounds in a double-overtime win without Fox.
- Game 2: Jalen Williams left with hamstring tightness, which hurt Oklahoma City’s depth for the next three games.
- Game 4: San Antonio used a 16-0 first-quarter run and a 22-5 third-quarter run to win by 21.
- Game 5: Gilgeous-Alexander scored 32 with nine assists to push the Thunder one win from the Finals.
- Game 6: The Spurs ran off 20 straight points while the Thunder went scoreless for more than seven minutes. Wembanyama had 28 points, 10 rebounds and three blocks.
In Game 7, the Spurs led 80-77 after three quarters and pulled away in the fourth. Wembanyama scored 22. Julian Champagnie added 20, and 18 of those came from three. Gilgeous-Alexander scored 35 for Oklahoma City, which played without Jalen Williams and Ajay Mitchell.
What the Numbers pool Tell Us Virtually Each Team up
The Thunder win through depth, spacing and ball security. In Game 3, their bench scored 76 points and their offense made 44.7% of its threes. When those shots fall, they beat anyone.
The Spurs win through star power and defense. San Antonio’s two big wins in Games 4 and 6 came by 21 and 27 points. Through six games, the Spurs won their games by an average of 18.3 points, while the series average margin stood at 15.3.
This chapter of the Oklahoma City Thunder vs San Antonio Spurs timeline came down to one pattern. Whichever team controlled turnovers and three-point variance won comfortably.
Looking at Back: However the Competition Has Unfolded Over Meter
The Oklahoma City Thunder vs San Antonio Spurs timeline shifts every few years as new stars arrive. George Gervin’s Spurs beat Seattle in 1982. In 2005, a 52-win Sonics team lost to the Spurs squad that won that year’s title.
The rivalry turned personal in 2012. San Antonio entered the West Finals on a 20-game winning streak and took a 2-0 lead. Oklahoma City then won four straight, and Kevin Durant scored 34 points with 14 rebounds in the Game 6 clincher.
San Antonio answered in 2014 behind Tim Duncan and went on to win the title. In 2016, a 55-win Thunder team upset the 67-win Spurs in six games. Durant scored 37 and Russell Westbrook added 28 in the closer.
The 2025-26 regular season foreshadowed the 2026 series. San Antonio won four of five meetings, including an NBA Cup semifinal in Las Vegas.
Why Player Stats Matter in This Matchup
Single numbers can mislead, and every stat in the Oklahoma City Thunder vs San Antonio Spurs timeline proves it. Gilgeous-Alexander shot 6-of-17 in Game 3 and still posted a +11. His free throws and passing made up for the misses.
Plus-minus also tells you who truly won the minutes. McCain and Caruso both finished +28 on the night. Johnson and Kornet finished -23 and -18 for San Antonio.
Turnovers, bench scoring and three-point percentage explain more of these games than raw points do. Watch those three numbers first in any future meeting.
Final Thoughts and Fan Community Takeaways
San Antonio won the rivalry’s most dramatic chapter, but Oklahoma City proved it can beat the Spurs with depth and shooting. This is a young rivalry between two teams that will meet often in the West.
Bookmark this Oklahoma City Thunder vs San Antonio Spurs timeline and check it after every meeting.
For official box scores, use NBA.com’s Game 3 box score. For the full game story, read ESPN’s Game 3 recap. For historical stats from earlier eras, search Basketball-Reference. Then tell the community which Game 7 moment you remember best.