
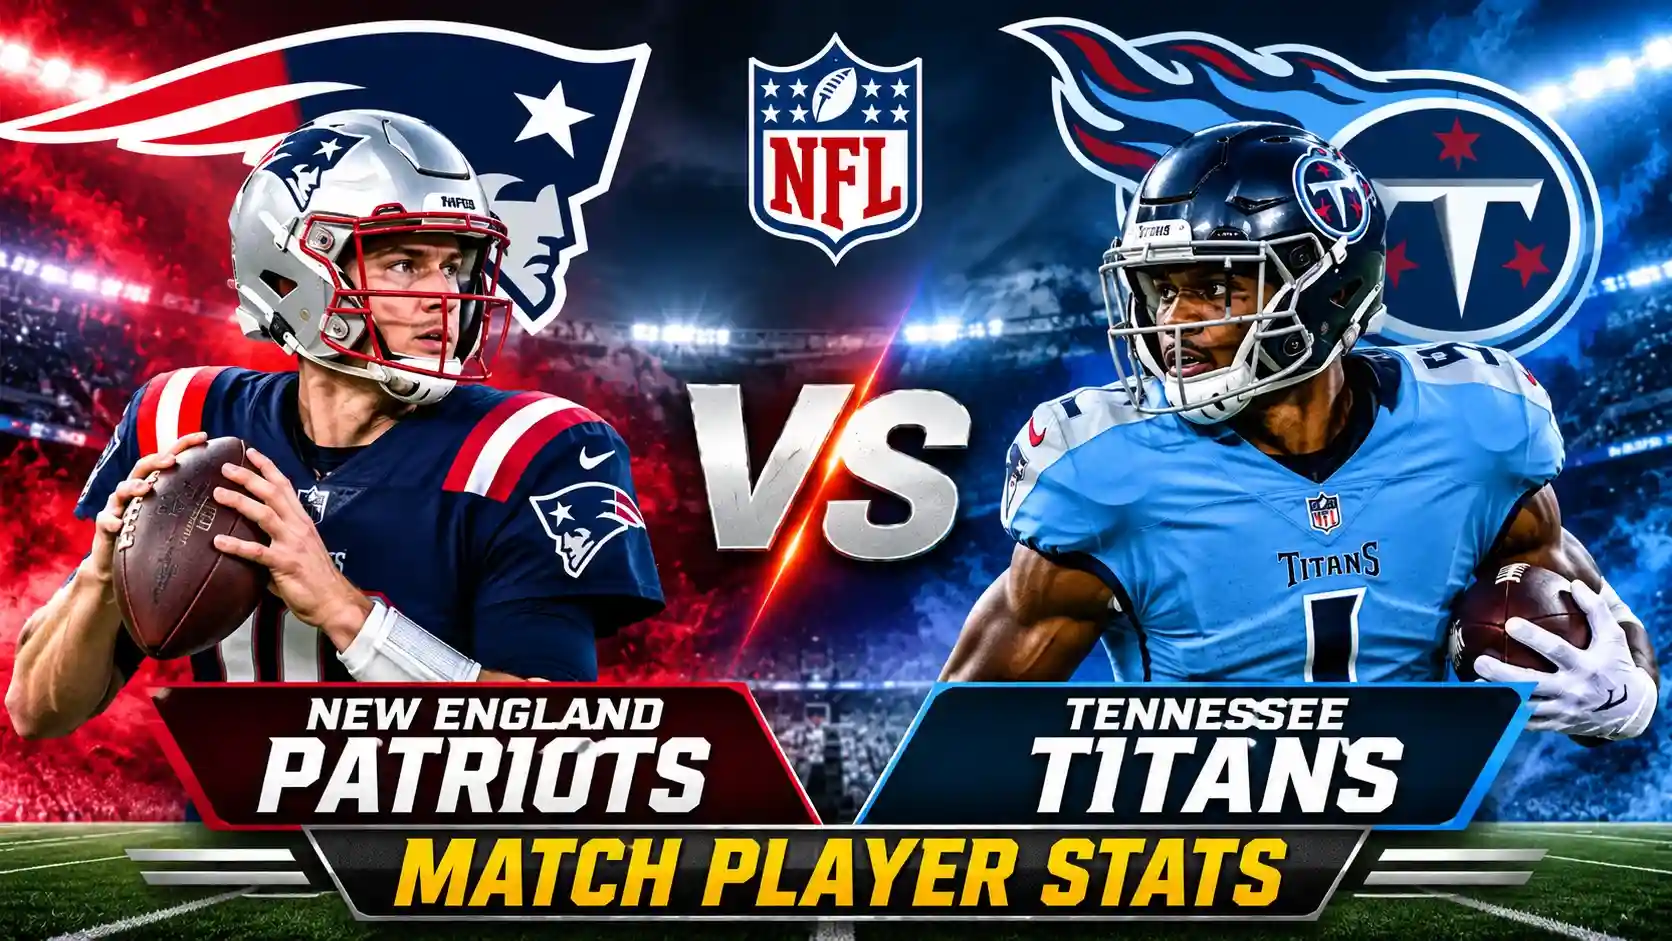
Finding clean, reliable numbers for a Patriots vs Titans game should not feel like a scavenger hunt. Box scores sit scattered across different platforms, each one slicing the data in a different way. This guide pulls every relevant new england patriots vs tennessee titans match player stats into one place. You get the full picture without jumping between tabs or guessing which source got the snap counts right.
A Quick Look at the Rivalry
These two franchises have met 46 times since 1960, when both began as charter members of the American Football League. The Patriots hold a 26–19–1 edge in the all-time series, a lead built largely during the Brady–Belichick era.
The postseason history adds extra weight. New England beat Tennessee 17–14 in a 2003 divisional playoff game that sent the Patriots to the AFC Championship. The Titans’ longest win streak in the series lasted four games from 1975 to 1980, while New England once rattled off seven straight wins from 2003 to 2018.
The Most Recent Matchup: Oct 19, 2025
The latest chapter unfolded at Nissan Stadium in Nashville, and it carried a storyline beyond the standings. Mike Vrabel coached his first game against the franchise that fired him in January 2024. His Patriots walked out with a 31–13 win.
Drake Maye turned in one of the cleanest passing lines you will see: 21 of 23 for 222 yards, two touchdowns, and zero interceptions. He also ran eight times for 62 yards. The Patriots scored 28 unanswered points across the second and third quarters to turn a 10–3 deficit into a 31–13 lead.
Team Totals and Efficiency Comparison
The new england patriots vs tennessee titans match player stats tell a story of control. New England ran 64 plays to Tennessee’s 51 and held the ball for 37:12. The Titans actually averaged more yards per pass attempt, but two turnovers and five sacks allowed erased that advantage.
| Stat | Patriots | Titans |
|---|---|---|
| Total Yards | 387 | 255 |
| Passing Yards (Net) | 212 | 216 |
| Rushing Yards | 175 | 39 |
| Yards per Play | 6.0 | 5.0 |
| First Downs | 22 | 16 |
| Turnovers | 0 | 2 |
| Sacks Allowed | 4 | 5 |
| Time of Possession | 37:12 | 22:48 |
New England’s ground game produced 175 yards on 36 carries, while Tennessee managed just 39 yards on 12 attempts. That gap kept the Titans one-dimensional and forced Cam Ward to throw 34 times.
Complete Quarterback Matchup and Passing Stats
Maye’s efficiency stood out, but Ward’s raw volume deserves a closer look. The rookie completed 25 of 34 passes for 255 yards, one touchdown, and one interception. He posted a 92.2 passer rating and averaged 7.5 yards per attempt, both career bests at that point.
| QB | Comp/Att | Yards | TD | INT | Sacks | Passer Rating |
|---|---|---|---|---|---|---|
| Drake Maye (NE) | 21/23 | 222 | 2 | 0 | 4 | 135.9 |
| Cam Ward (TEN) | 25/34 | 255 | 1 | 1 | 5 | 92.2 |
Maye’s 135.9 rating reflected a near-perfect command of the offense. He completed 16 consecutive passes at one point and never put the ball in danger. Ward showed poise in the first half but lost a fumble that turned into a defensive touchdown.
Rushing Leaders and Ground Game Performance
Rhamondre Stevenson carried the load with 18 attempts for 88 yards and a touchdown, both season highs at the time. He broke four tackles and averaged 4.9 yards per carry. Maye added 62 yards on eight scrambles, giving New England a second rushing threat that Tennessee could not contain.
The Titans never found a rhythm on the ground. Tony Pollard managed 18 yards on six carries, and Tyjae Spears added 22 yards on five attempts. As a team, Tennessee averaged 3.3 yards per rush.
| Rusher | Team | Carries | Yards | Avg | TD |
|---|---|---|---|---|---|
| Rhamondre Stevenson | NE | 18 | 88 | 4.9 | 1 |
| Drake Maye | NE | 8 | 62 | 7.8 | 0 |
| Tyjae Spears | TEN | 5 | 22 | 4.4 | 0 |
| Tony Pollard | TEN | 6 | 18 | 3.0 | 0 |
Receiving Production and Target Breakdown
Stefon Diggs led all receivers with seven catches on seven targets for 69 yards. Most of his damage came in the third quarter, when New England pulled away. Kayshon Boutte added a 39-yard touchdown catch, and Mack Hollins chipped in 49 yards on two receptions.
Tennessee’s Chimere Dike was the game’s most explosive receiver early. He caught a 38-yard touchdown from Ward and finished with 56 yards on two key first-quarter grabs. No other Titans receiver topped 50 yards.
| Receiver | Team | Targets | Catches | Yards | TD |
|---|---|---|---|---|---|
| Stefon Diggs | NE | 7 | 7 | 69 | 0 |
| Mack Hollins | NE | 2 | 2 | 49 | 0 |
| Kayshon Boutte | NE | 1 | 1 | 39 | 1 |
| Chimere Dike | TEN | — | — | 56 | 1 |
Defensive Plays, Turnovers, and Sacks
K’Lavon Chaisson delivered the defining defensive sequence. He recorded two sacks, including a strip-sack that he recovered himself and returned four yards for a touchdown. That score pushed New England’s lead to 31–13 and sealed the game.
Marcus Jones intercepted Ward late, and the Patriots finished with five sacks as a team. Marte Mapu added eight tackles and a tackle for loss. For Tennessee, the defense generated pressure on Maye but could not force a turnover.
| Defensive Stat | Patriots | Titans |
|---|---|---|
| Sacks | 5 | 4 |
| Takeaways | 2 | 0 |
| Fumble Recoveries | 1 | 0 |
| Interceptions | 1 | 0 |
| Defensive TD | 1 | 0 |
Step-by-Step Game-Changing Moments
The game turned on a three-touchdown stretch that began late in the second quarter. Austin Hooper caught a 3-yard score to tie the game at 10. Kayshon Boutte then hauled in a 39-yard strike just before halftime to give New England a 17–13 lead.
The third quarter broke Tennessee. Stevenson punched in a 4-yard run, and one play later Chaisson scooped up Ward’s fumble for a touchdown. In a span of roughly seven minutes, a 13–10 Titans lead became a 31–13 Patriots advantage.
What the Numbers Tell Us About Each Team
The new england patriots vs tennessee titans match player stats reveal a Patriots team built for balance. New England gained 175 yards on the ground and 212 through the air, keeping Tennessee off balance on every down. The Titans threw for 216 net yards but ran for only 39, making their offense predictable in obvious passing situations.
Tennessee’s rookie quarterback showed promise, but the five sacks and two turnovers highlight protection and ball-security issues that plagued the offense. New England’s zero-turnover performance is the statistical signature of a team that controlled the game from the second quarter onward.
Looking Back: How the Rivalry Has Unfolded Over Time
The 2024 meeting went the other way. Tennessee beat New England 20–17 in overtime on Nov 3, 2024, behind Mason Rudolph’s 240 passing yards and two touchdowns. That game required an extra period, and the Titans leaned on Rudolph’s connection with Nick Westbrook-Ikhine to seal it.
For broader historical context and cross-sport statistical comparisons, resources like mba.com offer analytical frameworks, while Pro Basketball Reference demonstrates how structured data can illuminate performance trends. For NFL-specific game logs, ESPN remains a standard reference. The Patriots’ 26–19–1 series lead reflects decades of shifting momentum, not a permanent hierarchy.
Why Player Stats Matter in This Matchup
Raw yardage rarely tells the full story. The new england patriots vs tennessee titans match player stats matter because they expose efficiency gaps that the final score can hide. Tennessee averaged 7.5 yards per pass attempt, slightly better than New England’s 7.6 net average, yet lost by 18 points. Turnovers and sack avoidance decided the outcome.
Maye’s 91.3% completion rate and zero interceptions created a floor that the Patriots offense could rely on. Ward’s career-best efficiency came with a fumble that turned into seven points for the opponent. Those are the margins that separate a clean statistical performance from a winning one.
Final Thoughts and Fan Community Takeaways
The new england patriots vs tennessee titans match player stats from Oct 19, 2025, show a Patriots team that protects the ball and finishes drives. Drake Maye’s efficiency, Rhamondre Stevenson’s physical running, and a defense that generated five sacks and two takeaways form a repeatable formula. Tennessee has a rookie quarterback with clear upside, but the protection and ball security must improve before the raw passing numbers translate into wins. Bookmark this breakdown for the next meeting, and compare the tables side by side when the teams square off again.